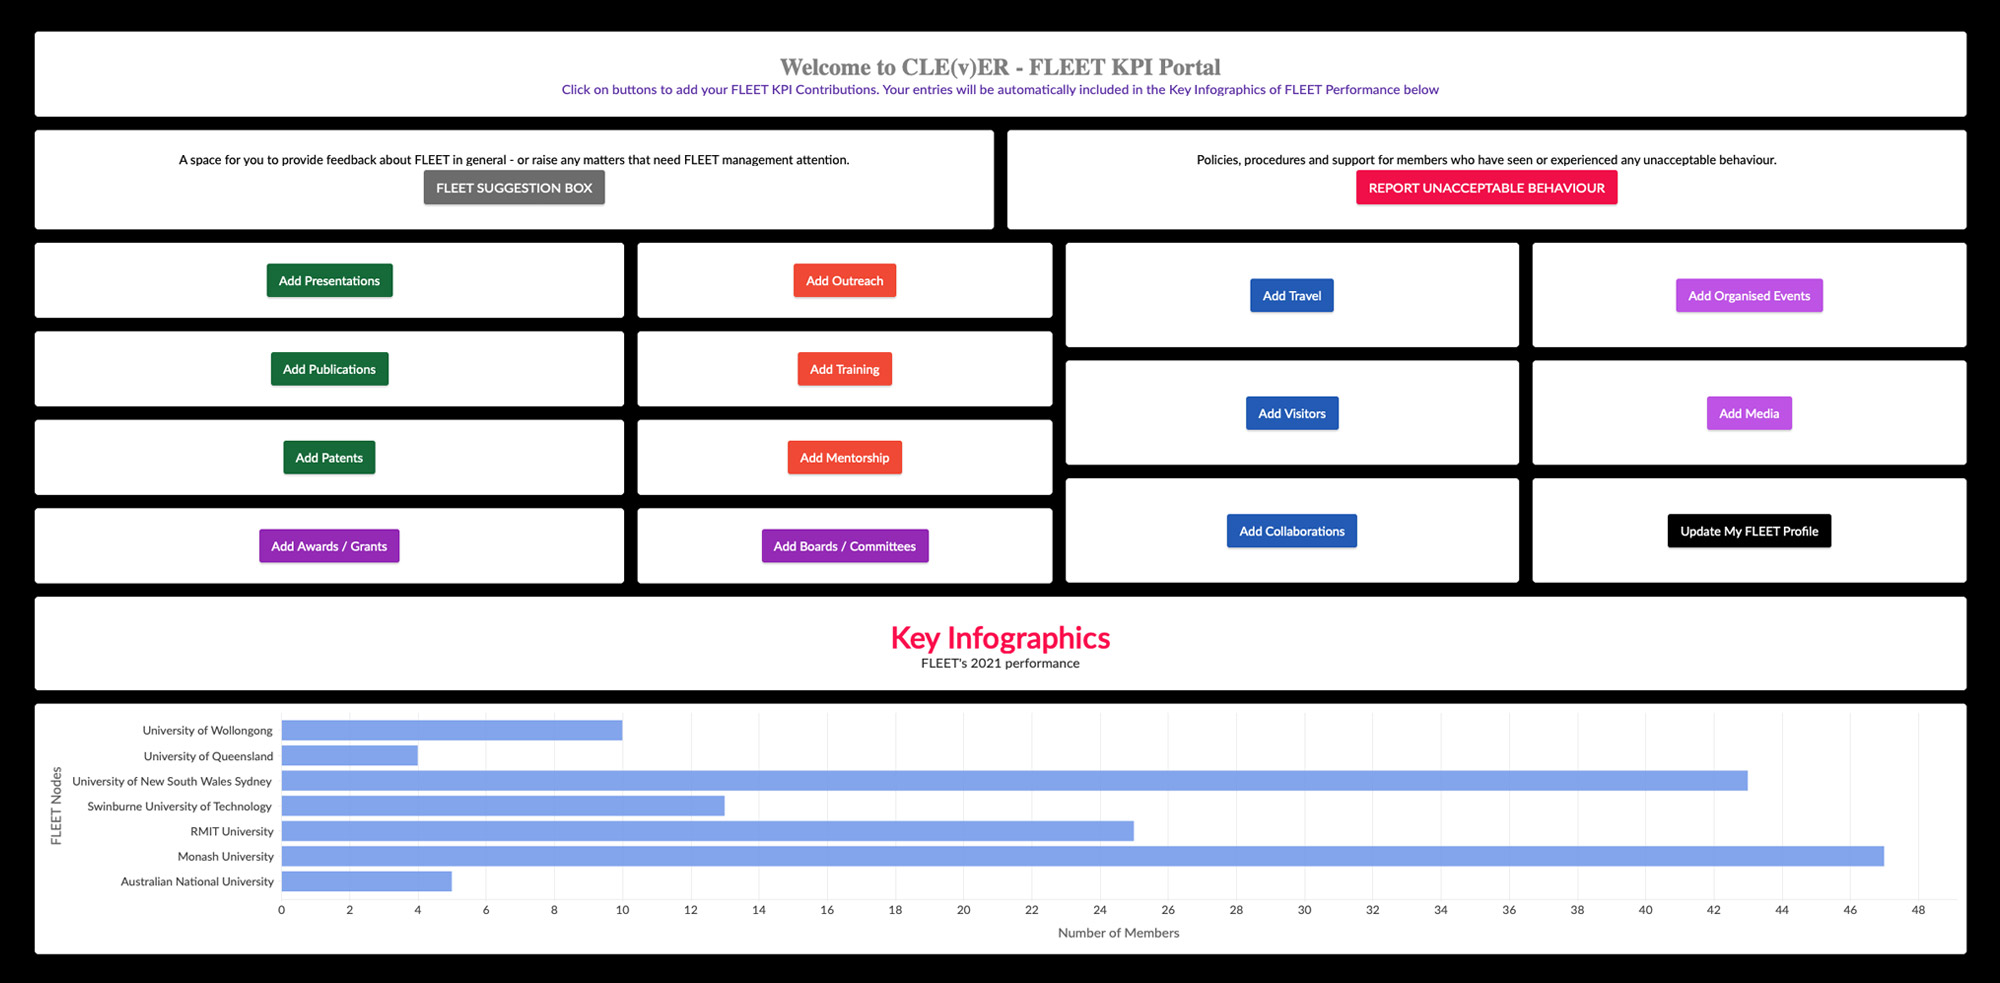
Key performance indicators

Click graphic to expand

Click graphic to expand
KPIs in detail
| Key Performance Indicators | Target 2020 | Actual 2020 |
|---|---|---|
| Research Outputs | ||
| Journal articles | 100 | 116 |
| Patents applied | 2 | 2 |
| Technical briefings presented to targeted industry groups | 1 | 6 |
| Publications in journals with IF >7 | 20 | 52 |
| Education & Training | ||
| Research & professional development courses | 6 | 7 |
| Training workshops on diversity and gender equity | 1 | 1 |
| Centre attendees at training workshops | 150 | 1349 |
| Non-Centre attendees at training workshops | 150 | 512 |
| Workshops held within Australia | 2 | 6 |
| Workshops held outside Australia | 2 | 0* |
| National symposium & conferences facilitated | 1 | 0* |
| International symposia & conferences facilitated | 1 | 1 |
| Industry engagement workshops to be held | 1 | 3 |
| FLEET Research Personnel | ||
| Postdoctoral researchers (total FTE) | 20 | 39 |
| Honours students (total) | 5 | 3 |
| PhD students (total) | 30 | 59 |
| Associate investigators (total) | 30 | 35 |
| PhD completions | 10 | 9* |
| Mentoring | ||
| Mentoring programs offered by the Centre | 4 | 4 |
| Mentors within the Centre | 40 | 41 |
| Mentors external to the Centre | 10 | 14 |
| FLEET members participated as mentees | 55 | 70 |
| Partnership development | ||
| Organisational links in training and mentorship programs | 5 | 4 |
| Presentations to stakeholders | 30 | 61 |
| New organisations collaborating with, or involved in, the Centre | 8 | 6 |
| Gender Equity | ||
| Percentage of women HDRs in FLEET | 25% | 25% |
| Percentage of women ECRs in FLEET | 25% | 30% |
| Recognition | ||
| Invited talks at international conferences* | 40 | 20* |
| New fellowships awarded to CIs, ECRs and AIs | 2 | 3 |
| Partnership development | ||
| International students and ECRs visiting FLEET | 10 | 2* |
| Senior investigators - International visitors to FLEET | 30 | 6* |
| Chief investigators visiting partners | 10 | 1* |
| ECRs & HDR students visiting partners | 15 | 6* |
| FLEET PR & Marketing | ||
| Non-peer reviewed works written by FLEET members | 5 | 18 |
| Mentions of FLEET research in the media | 250 | 534 |
| Unique hits to Centre website, monthly average | 600 | 2906 |
| Outreach | ||
| Hours spent in outreach activities | 1200 | 942* |
| Primary/Secondary students reached in outreach activities | 2000 | 1710* |
| Primary/Secondary teachers reached in outreach activities | 75 | 271 |
| Public reached in outreach activities | 5000 | 2214* |
| Organisational links in education and outreach programs | 10 | 26 |
| End-user relationships established | 10 | 14 |
| New Funding | ||
| Other research income secured by Centre staff (thousands) | 1500 | 8766 |
* KPI targets unmet due to impact of the global pandemic: conferences, meetings and public events canceled, travel bans, social distancing requirements, lock-downs and laboratory shut-downs and Centre reduced requirement of member outreach hour contributions as a mitigation strategy to look after members’ mental health and wellbeing.